Inclusion that comes off the paper
Vínculoo® is the special and inclusive education platform where the school understands each student, builds their plan and tracks what works.












A digital inclusion ecosystem: all in one place.
Understand
Who the student is, before any diagnosis.
Plan
The IEP, the PAEE and the AEE in one standard.
Follow through
The progress of every goal, across the year.
A platform that understandsspecial and inclusive education.
The functional profile, not the disability: the AI understands the student through uploaded documents and screenings, and maps the functional profile and the level of support.
The Individualized Education Plan (IEP) starts from what the school already does: the AI combines the lesson plan, the teaching sequence and/or the curriculum and builds the plan. The teaching team only reviews it.
Same content, a different path: the AI adapts the class activity for each student, in the format they need, and the teacher tracks what works.
Case Study
- Barrier
- Too many stimuli
- Communication
- Short phrases
- What helps
- A visual routine
filling in
Support level
All inone click.

- Prompts broken into steps
- Adjusted reading
- Command in the spotlight
- Maths and science
- Augmentative and Alternative Communication
- Audio and audio description
- Braille
- Libras (Brazilian Sign Language)
1. Understand
2. Plan
3. Monitor
Adapted resourceswithout changing the content.
Prompts broken into steps, adjusted reading, command in the spotlight, maths and science, Augmentative and Alternative Communication, audio and audio description, Braille and Libras: Vínculoo® adapts according to each student's functional characteristics and the support level of each one. The teacher gives the final adjustment.
- The command verb highlighted
- Prompt in steps, one per line
- Three options instead of four
- Readable formula and chart
1. Note that a square tile measures 12 cm along each side. Work out the area of this tile in square centimetres and tick, among the options below, the one matching the value you found.
2. A square plot of land has an area of 196 m². Knowing that the area of a square is the length of one side multiplied by itself, work out how long each side of this plot is and justify every step of your reasoning in the space below.
Figure 1 · square plot
3. The chart below shows how many books the class read in each term of the year. Looking at the data presented, how many more books did the class read in the 4th term compared with the 1st term?
Chart 1 · books read per term
1. Work out the area of the square tile with 12 cm sides.
- 1Multiply the side by itself: 12 × 12.
- 2Compare your result with the three options.
- 3Tick the option that matches your answer.
2. Find how long each side of the 196 m² plot is.
- 1Look for the number that, multiplied by itself, gives 196.
- 2Check the maths: 14 × 14 = 196.
- 3Write the measure with its unit: metres.
3. Compare the 1st and the 4th term on the chart.
- 1See how many books the class read in the 1st term.
- 2See how many books it read in the 4th term.
- 3Subtract the smaller from the larger: 24 − 12.

Drag the handle, or use the arrow keys
Any format.Any way of learning.
One platform, shaped to each reality.
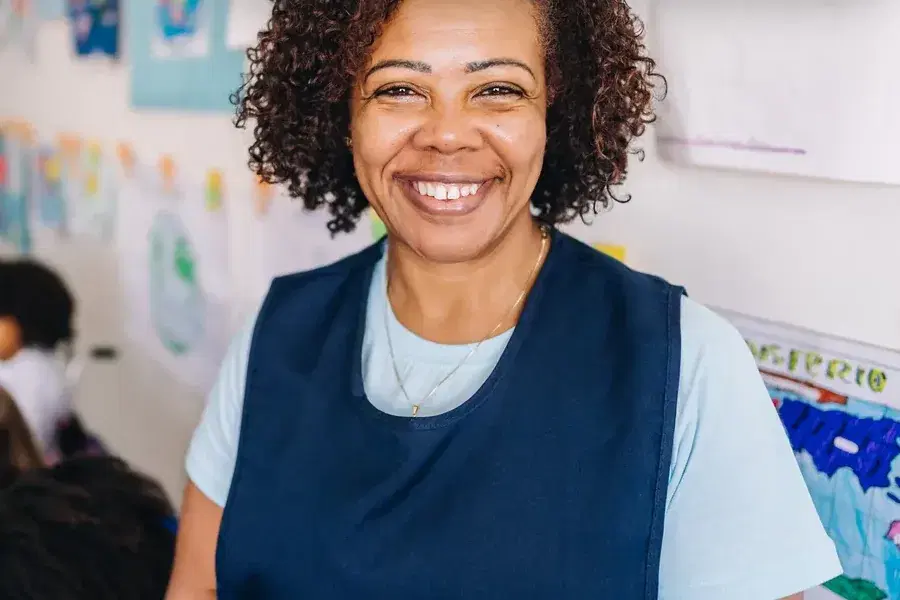
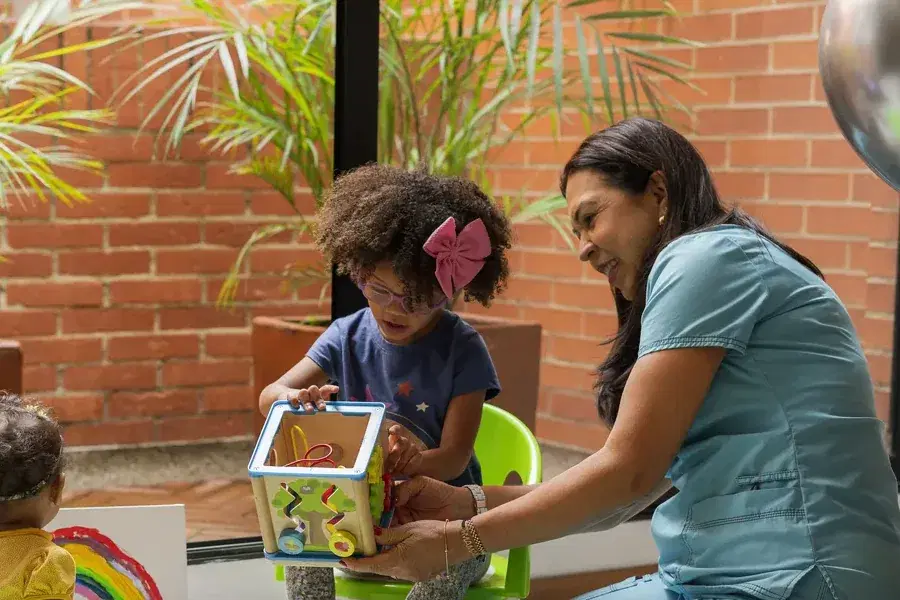
Private schools, public systems, multidisciplinary spaces and families look at the same student from different angles. Each one comes in through its own door.

Apoio Inteligente® drafts.The teacher decides.
The first AI specialised in special and inclusive education.
- 1Reads the Repertoire: assessments, reports and observations
- 2Cross-references the functional characteristics
- 3Drafts the goals and shows where each one came from
- ✓6 goals written. The teacher reviews and signs
What it hands back to the teacher.
- Educational plan
- Strategy suggestion
- Activity adaptation
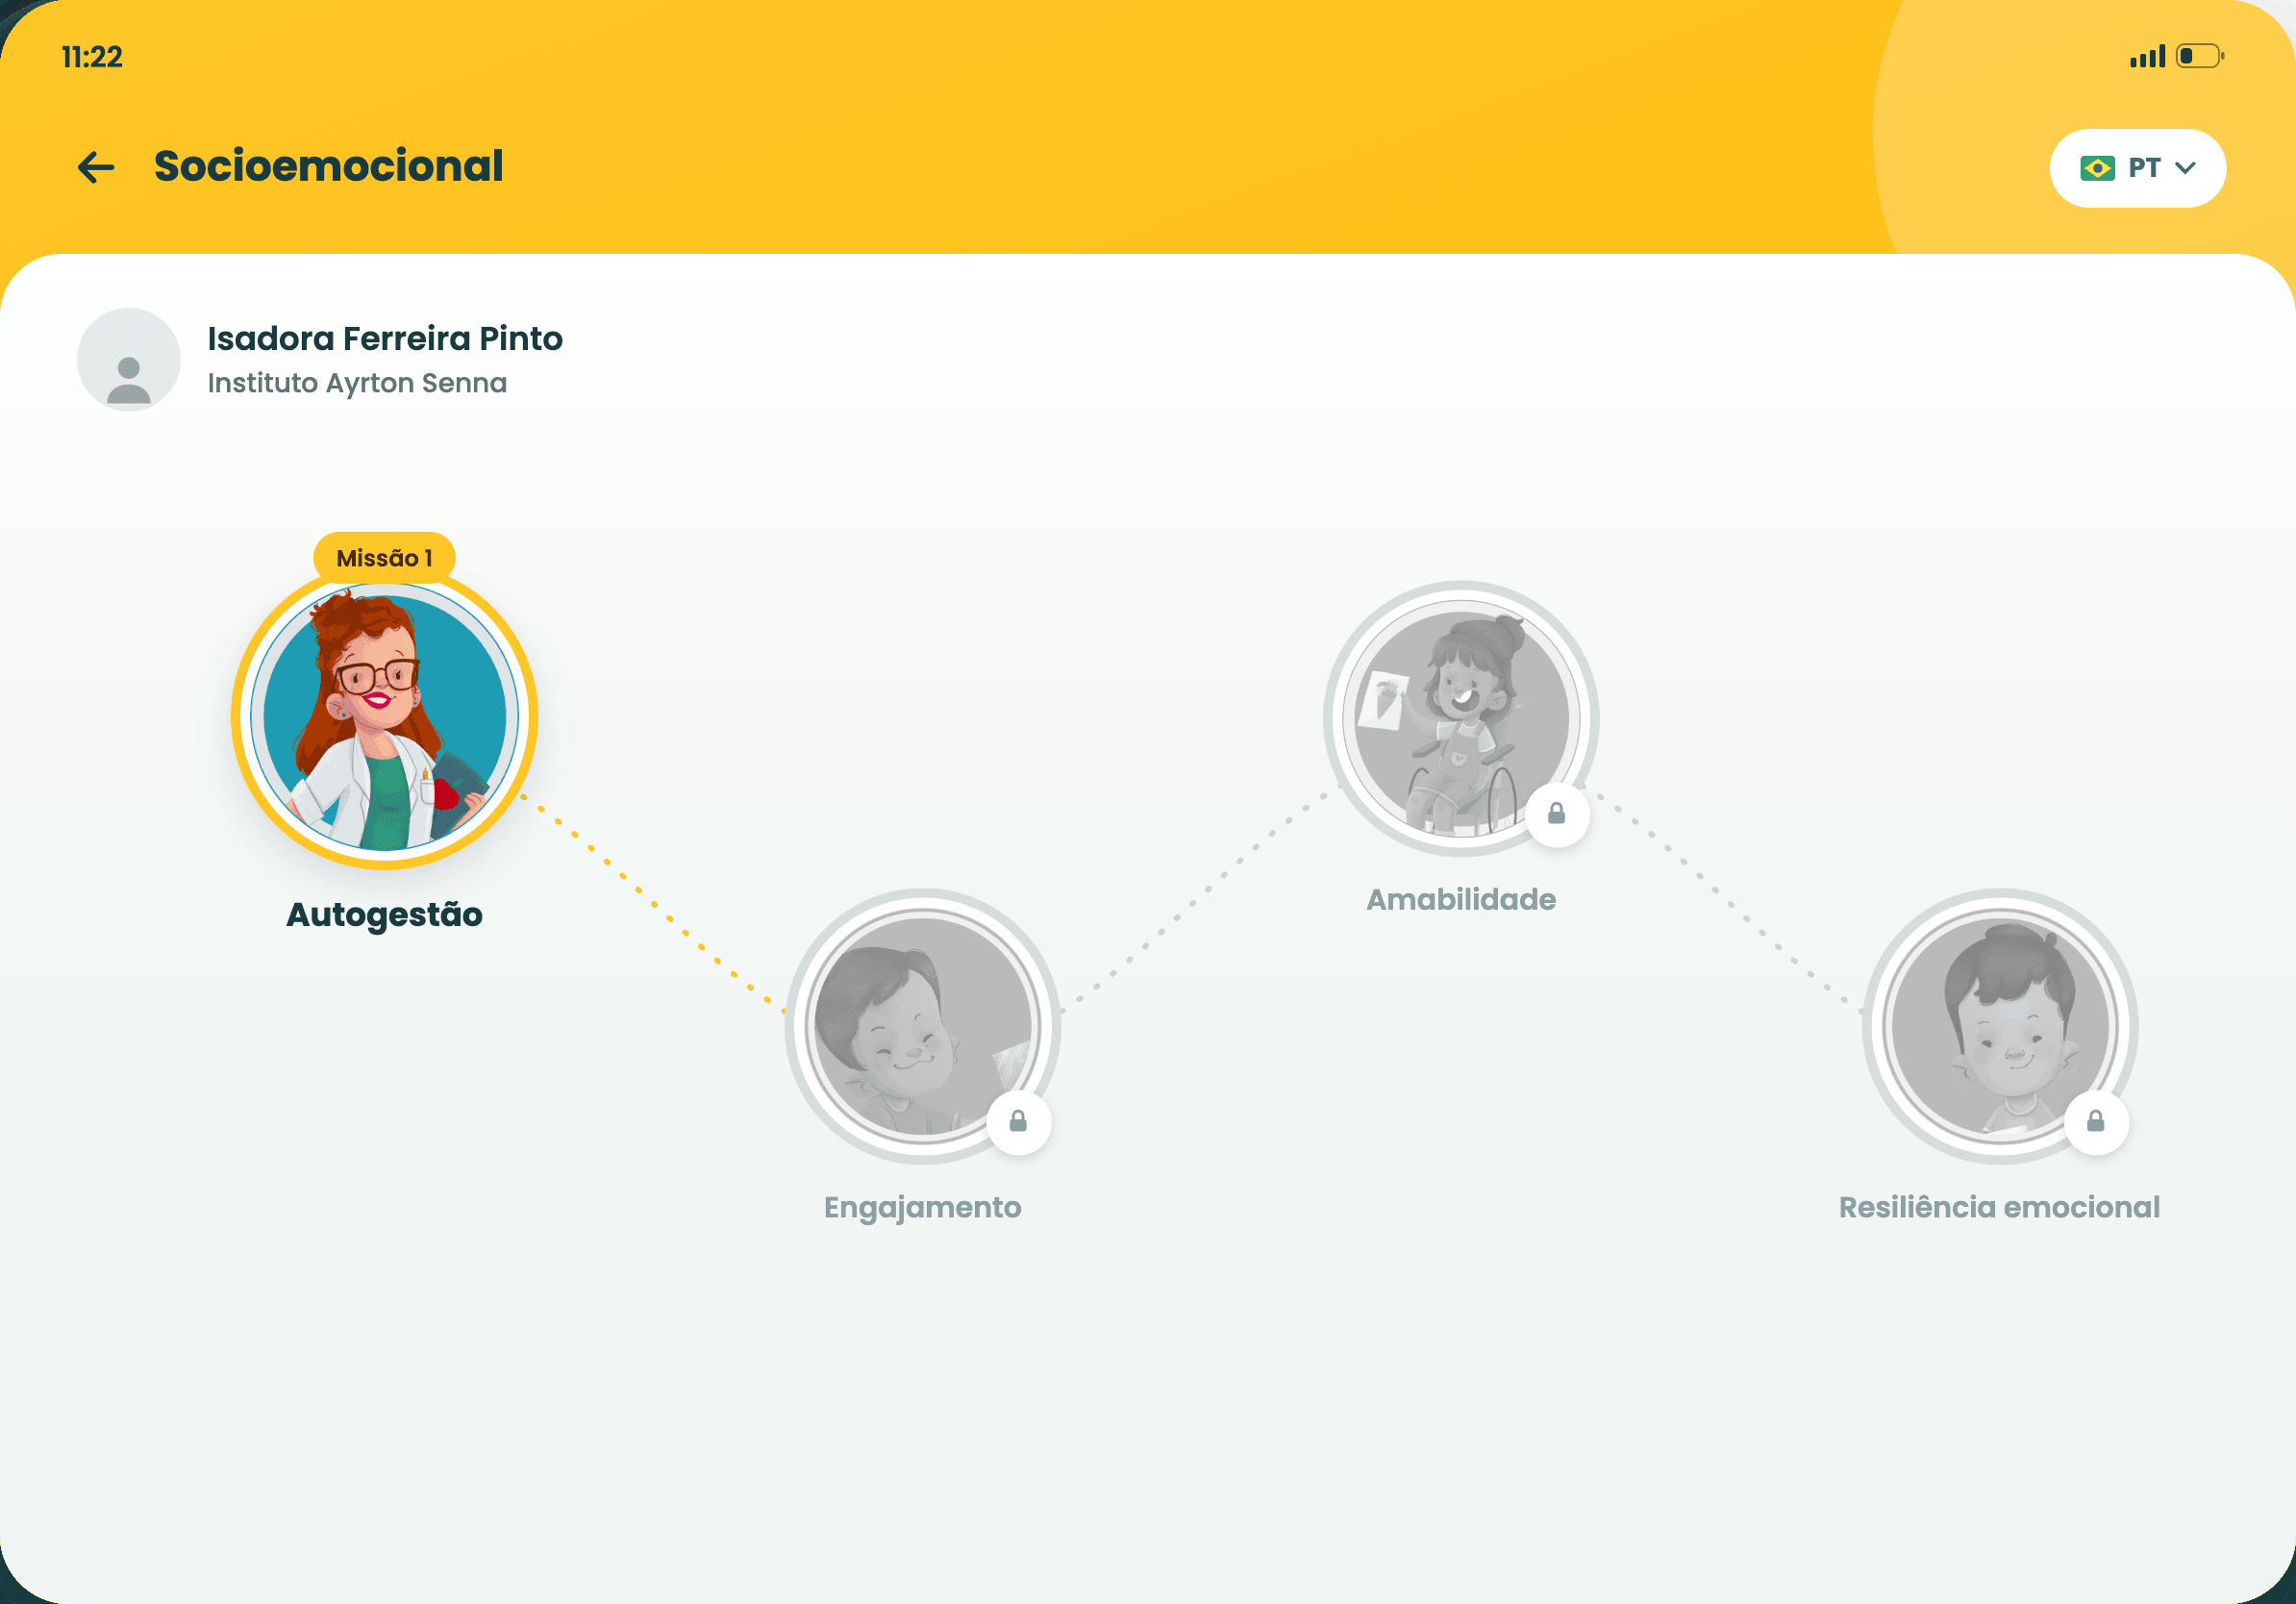
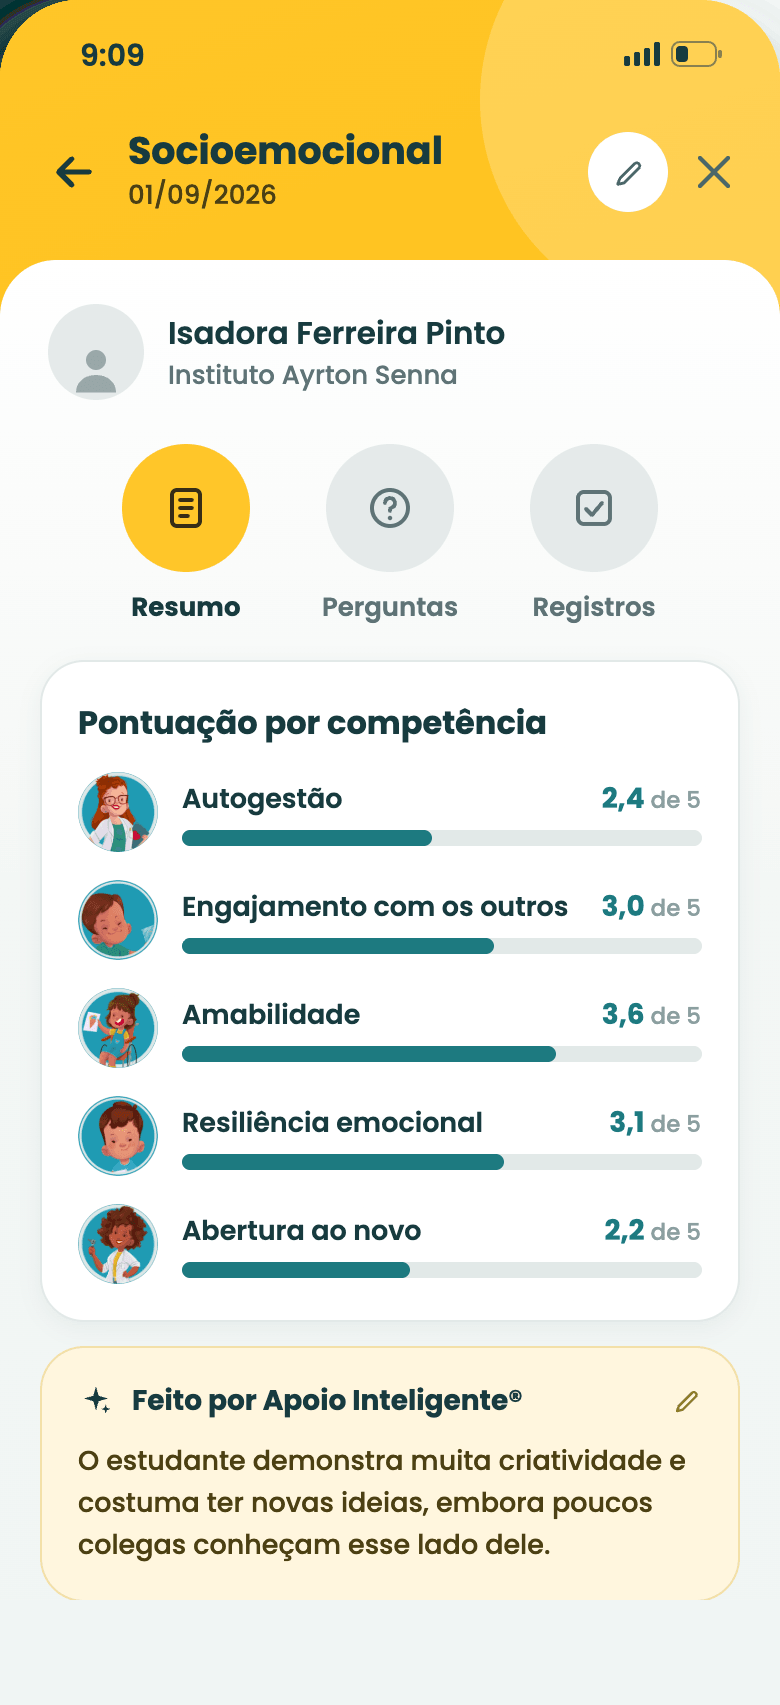
On the computer, the tablet and the phone.
It is the same platform on all of them, with the same data. The record happens right then, where the teacher is.
Available in the stores.


Also runs on
Our impact
- +356schools
- +17 thousandstudents
- +8 thousandactive teachers
However small it is, they always manage to move forward.
Beatriz BrunaldiPedagogical Coordinator
Every student is unique, and that doesn't have to become a burden on the teacher.
Nadine HeislerCo-founderIt's a tool that puts everyone on the same page to think about what is best for the student.
Ana Paula ManzalliCo-founder
Inclusion isn't an extra process: it's an integral part of our work.
Beatriz FormigaHistory teacherAny format, any way of learning.
Débora BritoCTO